Why Xencom Elemco Developed the UMR (Utility Management Report)
Based on this 30+ years of knowledge, experience, and research of energy evaluation systems on the market, we decided to develop the UMR, Utility Management Report, our own Web based database management portal that is custom tailored for projects that have multiple utility meters and retail energy providers (REPs).
Typically, when a facility owner receives the utility bills, they simply enter the final costs into the accounting system. Some of the more sophisticated owners also enter the consumption and flow rate of the commodity (e.g. kWh and kW) into a Spreadsheet for review and comparisons.
Over the past 30 years Xencom has provided energy management systems to the industrial, commercial office building and shopping center industries with the expectation of lowered energy usage/costs and a reasonable return on investment. Until now Xencom used multiple spreadsheets to show these reductions in in utility usage, savings and paybacks.
We provide a secure, cloud-based storage environment utilizing AWS (Amazon Web Services). The data is continually backed up and the customer always retains ownership of the data. They can request a copy of the up-to-date database at any time (several data formats available).
We have been using this program successfully for decades with our energy management and procurement customers. We are now offering it as a standalone program.
Xencom’s Advantage
Experience and Knowledge from the Supply Side to the Demand Side– Xencom Elemco provides Energy Management, Control Systems, and Energy Services to more than 200+ large properties nationwide. In addition, we are actively involved with some of the nation’s largest owners, managers and developers of commercial real estate providing energy procurement, curtailment, demand response programs, rebate fulfillment and contract/rate negotiations. We deploy “Best Practices” when it comes to providing sustainable facilities and LEED Certification.
Why Our Customers Use UMR – Results!!
Below are some examples of past benefits from Utility Management Report tracking
After providing the initial setup and entering all variables of the electric bill into the UMR, we discovered a very high kW demand for one month on one of the meters. We analyzed the data from that meter and the potential electric load from the associated site equipment and found that even if all the lights and HVAC (at full load) were turned on at the same time, it could not have caused a kW demand as high as was noted on the bill. After several negotiations with the local utility, we were able to secure a $46,500 refund for our customer.
We discovered during the initial setup phase that the facility’s (20 years ago) contract demand rate was established based on the assumption that the facility would double in size in the very near future. This expansion never took place but, nevertheless, the facility was paying for the anticipated future capacity. We were able to lower the contract demand and saved the facility over $5,000 in the first 12 months of the contract.
We discovered during the initial program setup phase that a new Time-of-Day rate was available from the utility for a select group of large users. Using the past 12 months billing data, we ran an analysis of the facility’s electric bills using this new rate and determined that there was an opportunity for significant savings by switching to this Time-of-Day tariff. After switching the rate, we reprogrammed the sequences and schedules in the EMS to take full advantage of the new rate. The facility saved $250,000 in the first 12 months on the new TOD rate without compromising the facility’s environment or light levels .
After converting the facility to a Time-of-Day rate, we could not correlate real time meter readings (EMS was monitoring the Utility Meter) to billing data. We found that the utility had failed to properly program weekend rates into their time of day meters, thus over charging the customer for kWh in off peak times. After proving that the utility meters were incorrectly configured, we were able to get the customer a $16,500 refund.
We discovered during the initial program setup phase that the facility was being penalized based on a low power factor (85%). We worked with the facility and proposed new power factor correction equipment. This equipment was installed, and our customer realized a 60% return on their investment.
While entering data from the Regulated Utility and Deregulated REP, we found discrepancies in the amount of kWh being billed by the REP. By pointing this out to the REP, we were able to negotiate a settlement with our customer that saved them $81,000.
Having long term history of typical kWh, kW and Costs of our customer’s facilities at our fingertips has helped us negotiate lower electrical procurement rates for our customers. Knowing the baseline usage along with possible changes in the facility’s operations, has enabled us to negotiate better pricing and tighter band widths where available. We have saved our customers millions of dollars over the last decades through intelligent procurement of their electricity and gas.
Analysis & Analytics
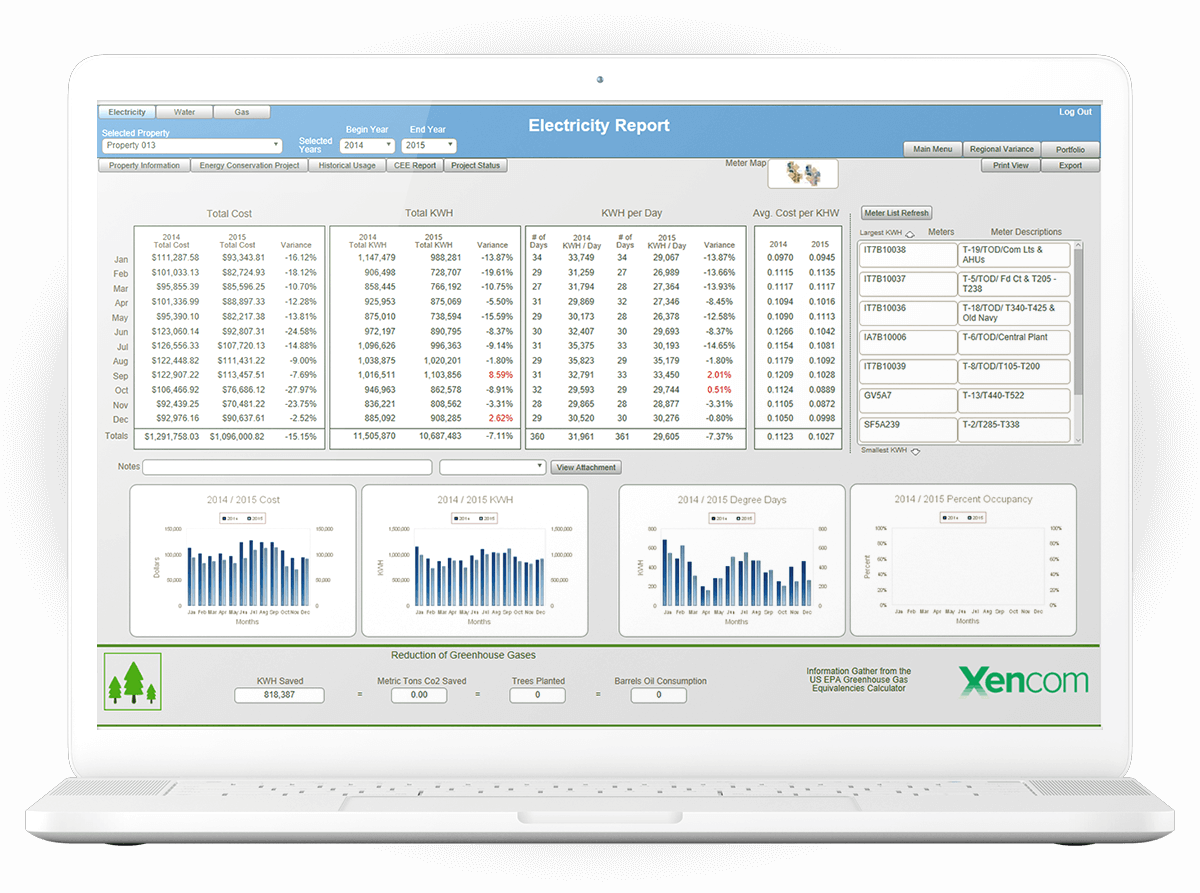
Utility Management & Reporting (UMR) – Electric & Gas
Solutions through Key Performance Indicators
Reports
- View by Project and Meter
- KWH
- KW
- Cost
- Historical Data
- Normalization
- Occupancy
- Weather
- Tracking of Energy Projects (ROI)
- Portfolio Review & Reports
- Utility Data Storage
- Utility Contacts
- Copies of Rates Structures
- Copies of Bills
- Real Time Comparisons
Utility Management & Reporting (UMR) – Water
Water is becoming one of our most precious and valuable resources. In some areas water use is already being restricted or the customer is severely penalized if they use more than their allocation. But before you can optimize water usage and its components, you must know where and how water is used. Once we have this history, we can help develop a strategy to help with conservation measures.
Auditing and Benchmarking
Water bills are made up of more components than just gallons used. Often sewer and storm water runoff charges are also included. It is very important to know where and how the water is being used.
- Track Gallons Used (by meter)
- Building use
- Irrigation
- HVAC – Cooling Towers
- Track Sewer Charges
- Track Runoff Water Charges
Conservation Measures
- Knowledge & Education of users
- Efficient Fixtures in the Restrooms
- Water Wise Landscaping Principles
- Smart Irrigation Systems
- Improve Cooling Tower Efficiency
- Meter Cooling Tower Make Up Water
- Air Conditioning Condensate Recovery
- Steam Heating System Condensate Recovery
- Water Storage Systems (Ponds & Cisterns)
